For this lesson, we learned how to perform the data analysis, and conduct an analysis on either 1 of 2 Case Studies given to us to investigate the significance of factors affecting our end results.
The link to the Excel File with the Tabulated Data can be found here:
https://ichatspedu-my.sharepoint.com/:x:/g/personal/firmanshah_20_ichat_sp_edu_sg/ESJX768820tBgfI_58J-xNYBzvE0WHGkXmGjmGUBQHKzOg?e=FLMweV
https://docs.google.com/spreadsheets/d/1AHmXrDvZtug5y3Wha5cvKsvutLilrSr7/edit?usp=sharing&ouid=104066021447226203600&rtpof=true&sd=true
This is the Case study that me and my other groupmate chose:
Before beginning the data analysis, we tabulated all of the data into a single table in the excel sheet and assigned the values in each Factor with its respective tag (+ and -).
Full Factorial Data Analysis
Firstly, we calculated the average values of each factor.
Secondly, using these values we calculated, we tabulated a graph which displayed the significance of each factor. The significance can be seen in the gradient of each respective line.
By comparing these gradients, we can determine which factor has the strongest effect on the desired result. The steeper the gradient was, the more it would affect the end result. Factors C and A shared a similar steep gradient, while Factor B has a very gentle gradient.
From the above graph, we concluded that the most significant factors were A(Concentration), then C(Stirring Speed), followed by B(Treatment Temperature).
Most to Least significant: A>C>B.
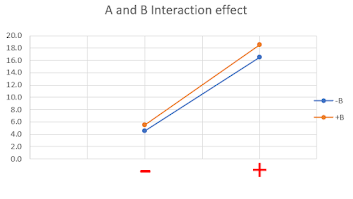
Interaction Effect for Full Factorial
After determining the significance of each individual factor, we then moved on to find out how each factor would affect one another.
These were the results as follows:
For the interaction between factors A and B, the gradients of both lines are very similar, and thus there is no significant interaction between them.
For the interaction between factors A and C, the gradients of both lines are vastly different in terms of steepness, and thus there is as a significant interaction between them.
For the interaction between factors B and C, the gradients of both lines are very similar, and thus there is no significant interaction between them.
To conclude, after conducting the Full Fractional Data Analysis, Factor C, which is the stirring speed, is the most important factor in affecting our amount of Pollutant discharged per days(Response Variable/y), followed by the Coagulate Concentration and Treatment temperature.
Fractional Factorial Data Analysis
For this case study, I have chosen to take Runs 1,4,6 and 7 to use in my fractional factorial data analysis. These runs are balanced in terms of their high and low values, with each factor containing an equal number of each which are well spread out within themselves.
Firstly, I once again calculated the average of each factor at each value (+ and -):
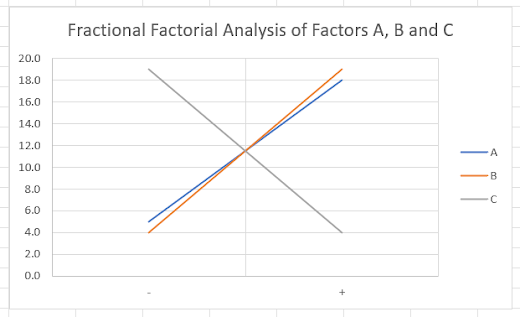
Secondly, using the tabulated values, I charted another graph to display the significance of each factor and do comparisons between them based on each line's gradient.
Comparing this graph to the graph tabulated in the Full factorial data analysis, we can infer that the gradients of 1 factor's lines on the graph has steepened, which would factor B.
Based on the above graph, I could conclude that the ranking of the most significant factors would be: C(Stirring Speed) and B(Treatment Temperature), then A(Concentration of Coagulant Added)
Most to least significant: C=B>A.


Comments
Post a Comment